How many trips a returnable pallet needs before it beats wood on carbon
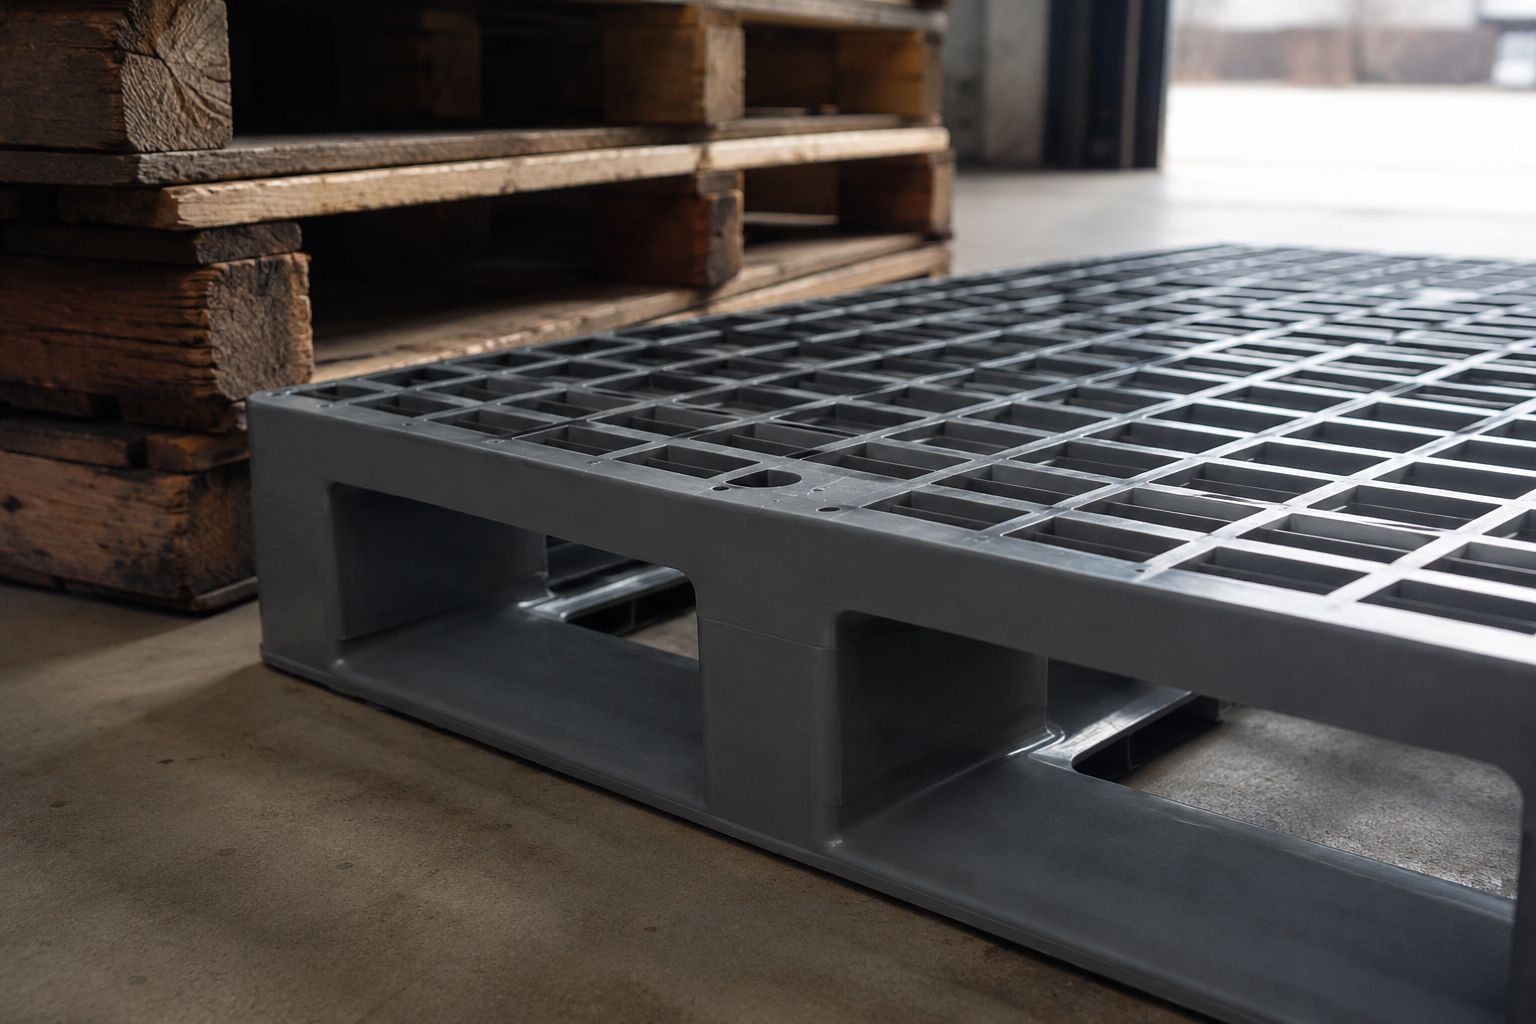
Most sustainability claims about
returnable packaging are made without the condition that makes them true. A
plastic pallet is not automatically the lower-carbon option. It starts life
carrying a significantly higher embodied footprint than a wooden pallet, and it
only overtakes wood after it has completed enough trips to spread that
footprint thin.
That number of trips is the
break-even point. It is the single most important figure in any honest
comparison, and almost nobody publishes it, because the answer depends on how
the system is run rather than on what the product is made of.
This article sets out what the
research says, how to calculate the break-even point for your own operation,
and what causes a returnable system to never reach it.
Where the carbon actually sits
For a single-use item, most of the
footprint is in production. For a returnable item, production is a fixed cost
paid once and then divided by every trip the asset completes. Twenty trips
means one twentieth of the manufacturing emissions per trip. Two hundred trips
means one two-hundredth.
This is why the reuse count
dominates everything else in the calculation, and why transport of empties is
the second largest factor. Reviews of the reusable packaging literature
consistently identify transport as the most influential life-cycle stage once
an asset is in circulation, with washing typically a minor contributor by
comparison.
What the published studies show
The figures below come from
peer-reviewed life cycle assessments. They are drawn from European, Australian
and North American supply chains, so they should be read as a starting frame
rather than as GCC numbers.
•
Manufacturing.
A study of EUR-sized pallets
published in E3S Web of Conferences found the cradle-to-gate footprint of a
virgin plastic pallet to be around 62 kg CO2-eq, against roughly 5 kg CO2-eq
for a wooden pallet before any carbon sequestration is credited.
•
Export
treatment. Wooden
packaging used in international trade must be treated under ISPM 15. Research
published in the Journal of Industrial Ecology puts conventional heat treatment
at roughly 12.7 kg CO2-eq per pallet and methyl bromide fumigation at roughly
16 kg CO2-eq. Plastic pallets are exempt from this requirement entirely.
•
Full
life cycle. An
Australian cradle-to-grave study in the Journal of Cleaner Production found
plastic pallets carried a higher footprint than wooden pallets over 100 trips,
driven largely by production and by longer distances travelled.
•
Break-even
range. A literature
review of reusable packaging systems found break-even points ranging from 2 to
50 reuses depending on the case, with loss rate and distribution distance
identified as the decisive variables.
Read together, these tell a
consistent story. Plastic does not win by default, and in several published
scenarios it loses. It wins where the trip count is high, the return leg is
short and the fleet is retained.
Calculating your own break-even
point
The arithmetic is simple enough to
do on paper.
Break-even trips = embodied carbon of the plastic pallet divided
by the carbon of the wooden pallets it replaces per trip.
The second figure is the one
people get wrong. It is not the footprint of a wooden pallet. It is the
footprint of a wooden pallet divided by the number of trips that wooden pallet
completes before it is written off, plus any treatment carbon it carries.
Three scenarios show how widely
the answer moves. All use the published figures above and are illustrative
rather than audited.
One-way export shipments. The wooden pallet is heat treated
and used once, so it carries roughly 18 kg CO2-eq per trip. The plastic pallet
breaks even at around four trips. In this scenario the returnable case is
overwhelming.
Regional distribution with pallet
recovery. The wooden
pallet is heat treated and completes three trips before write-off, so around 6
kg CO2-eq per trip. Break-even lands near eleven trips. Comfortably achievable
in a managed system.
Domestic closed loop, no export
treatment. The
wooden pallet is untreated and completes five trips, so around 1 kg CO2-eq per
trip. Break-even now sits above sixty trips. Achievable, but only if the fleet
stays intact for years.
The same product produces
break-even points ranging from four trips to over sixty, purely because of what
it is being compared against. Any supplier quoting a single universal number is
not describing your operation.
The number that quietly destroys
the case
Every calculation above assumes
the pallet completes the trips it was designed for. In practice, the figure
that belongs in the calculation is not the catalogue service life. It is the
effective trip count after losses.
Units disappear from returnable
fleets for ordinary reasons: they leave with a customer and never come back,
they are absorbed into a third party’s pool, they are damaged by handling
equipment, or they are quietly repurposed on site. A fleet losing a meaningful
share of its units every year will not reach its nominal service life on
average, and the per-trip carbon rises in exact proportion.
A pallet rated for 100 trips that
averages 30 before disappearing has more than tripled its carbon per trip. In
the domestic closed-loop scenario above, that pallet never breaks even at all.
A returnable packaging system that leaks assets is not a
sustainability programme. It is a slower, more expensive way of buying
single-use packaging.
What changes the maths in the GCC
The published studies were not
modelled on Gulf supply chains, and several regional conditions shift the
result.
•
There
is no significant local softwood supply. Wooden pallets used in the region are
largely built from imported timber, adding transport emissions that European
and North American studies do not carry.
•
Polymer
feedstock is produced regionally. Resin sourced from Gulf producers travels a
short distance to the moulding facility, which reduces the plastic pallet’s
inbound footprint relative to studies assuming imported material.
•
Heat,
humidity and washdown shorten wooden pallet life, particularly in food,
beverage and cold chain use. Fewer trips per wooden pallet raises its per-trip
carbon and pulls the break-even point closer.
•
Export
volumes are high, and ISPM 15 treatment applies to every wooden pallet leaving
the region. That treatment carbon is avoided entirely with plastic.
•
Return
legs vary enormously. A closed loop inside one industrial city is short. A UAE
to Saudi lane is not, and empty repositioning over that distance consumes a
real share of the benefit.
On balance these conditions move
the break-even point in favour of returnable plastic compared with the
published European and Australian cases, but the direction of the shift is not
the same as the size of it. That still has to be calculated lane by lane.
Designing a system that actually
gets there
If the break-even point is what
matters, then the decisions that matter are the ones that raise trip count and
cut return distance.
•
Deploy
returnable assets on dedicated, closed lanes first, not across the whole
network at once.
•
Track
the fleet. Deposits, chargeback agreements and barcode or RFID identification
exist because retention is the variable with the largest effect on the outcome.
•
Specify
nestable or foldable designs where empties travel back. Return transport is the
second largest emissions contributor, and it is largely volume driven.
•
Avoid
over-specifying weight. A heavier pallet than the load requires carries
embodied carbon on every trip for no operational benefit.
•
Plan
the end of life at the point of purchase. Recovering worn units for regrind
closes the loop and recovers part of the original footprint.
•
Report
conditionally. State the trip count and retention rate your figures assume, so
the claim survives an audit.
The honest summary
Returnable plastic packaging is a
strong carbon proposition, but it is a conditional one. It is not a property of
the material. It is a property of a system that keeps its assets, uses them
often, and does not haul empty air across the region to do it.
Any supplier who tells you their
pallet is greener without asking how many trips it will make is selling you a
claim you will not be able to defend.
Working out your own numbers
IPlast Industries manufactures
plastic pallets, crates, foldable containers and bulk handling products at
facilities in Abu Dhabi, UAE and Al Jubail, Saudi Arabia. Our engineering team
reviews the application, the lane and the expected trip count before recommending
a specification, so the sustainability case and the cost of ownership case rest
on the same set of assumptions.
To review the break-even position
for your own operation, contact us at info@iplastindustries.com.
SOURCES REFERENCED
•
Carbon
footprint of an EUR-sized wooden and a plastic pallet, E3S Web of Conferences,
2020.
•
Life
cycle assessment comparison of wooden and plastic pallets in the grocery
industry, Journal of Industrial Ecology, Vol. 24 Issue 4, 2020.
•
Carbon
footprint of wood and plastic as packaging materials – An Australian case of
pallets, Journal of Cleaner Production, 2022.
A literature review and analytical framework of the sustainability of reusable packaging, Sustainable Production and Consumption / ScienceDirect, 2023